
www.stateofthecoast.scot
www.stateofthecoast.scot
Between 2001 and 2022, numbers of people in full time employment in East Grampian have remained relatively stable (Fig.1). However, looking at 2022, the number of people in full time employment is below the national average (Fig.2).
Numbers of people working part time and who are self employed have increased over 2001-22, with both of these groups higher than the national average in 2022.
Numbers of retired people increased between 2001 and 2011 significantly, but fell between 2011 and 2022. This could be due to increase mortality in the older population due to the COVID-19 pandemic, although 2022 figures show the proportion of retired people in East Grampian is significantly higher than the national average (Fig.2).
Numbers of full time students in East Grampian has increased over 2001-22, but remained below the national average in 2022.
Overall, 69% of people are in employment or studying on the East Grampian Coast. In 2022, this was significantly lower that the national average at 77%. The number of people in East Grampian not in employment or studying is 30%, compared to the national average of 22%.
These figures have been taken from census records relating to selected coastal wards.
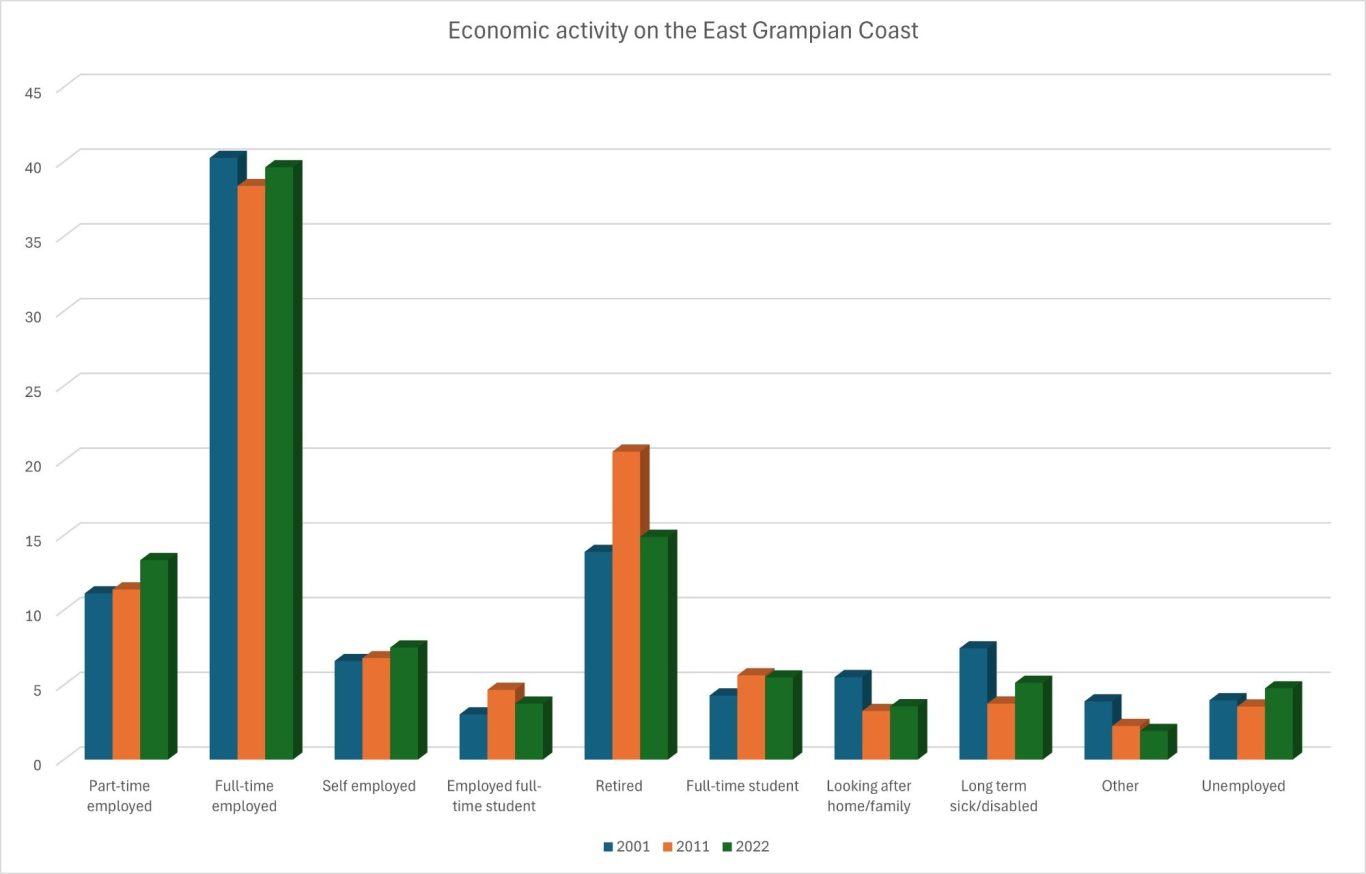
Figure 1: Economic Status on the East Grampian Coast (Census Data 2001, 2011, 2022)
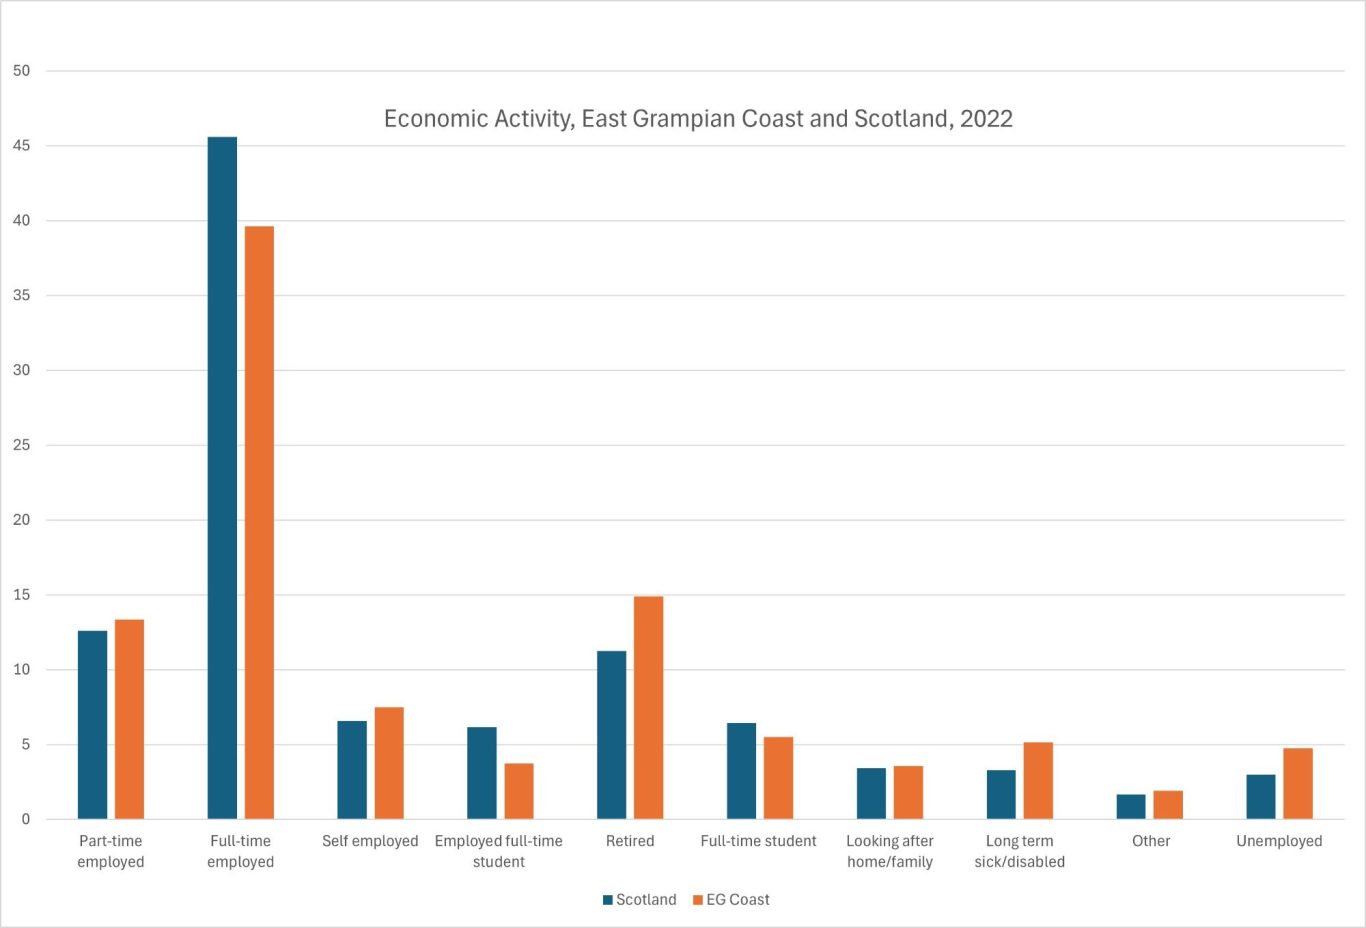
Figure 2: Economic Status on the East Grampian Coast and Scotland (Census Data 2022)
The areas included in the East Grampian statistic can be seen following this link.
18/03/2025 by Ian Hay
20/03/2025 by Charlotte Tomlinson
Live - next update 18/03/2027
To report errors, highlight new data, or discuss alternative interpretations, please complete the form below and we will aim to respond to you within 28 days
Telephone: 07971149117
E-mail: ian.hay@stateofthecoast.scot

We need your consent to load the translations
We use a third-party service to translate the website content that may collect data about your activity. Please review the details in the privacy policy and accept the service to view the translations.