
www.stateofthecoast.scot
www.stateofthecoast.scot
Age profiles are taken from Scottish Census data. This has been again for the East Grampian Coast by selecting specific wards.
The East Grampian Coast census data for 2001 (Fig. 3), 2011 (Fig. 2) and 2022 (Fig. 1) shows a higher percentage of the population in the 16-29 and 30-44 age categories than the rest of Scotland. However, both in the younger or older age categories East Grampian had less in these categories than Scotland as a whole. This could be explained by high numbers of students and workers moving to the area. However, the reduction in the number of people in the 45-59 age category needs more investigation to understand.
For both Scotland and the East Grampian Area the percentage of the population in the 0-4 and 5-15 age categories reduced between 2001 and 2011, but increased slightly in 2022.
The number of people in the 60-74 and 74+ age categories is considerably lower for the East Grampian Coast than Scotland as a whole. However, these figures have increased for both areas between 2001 and 2022, showing an aging population.
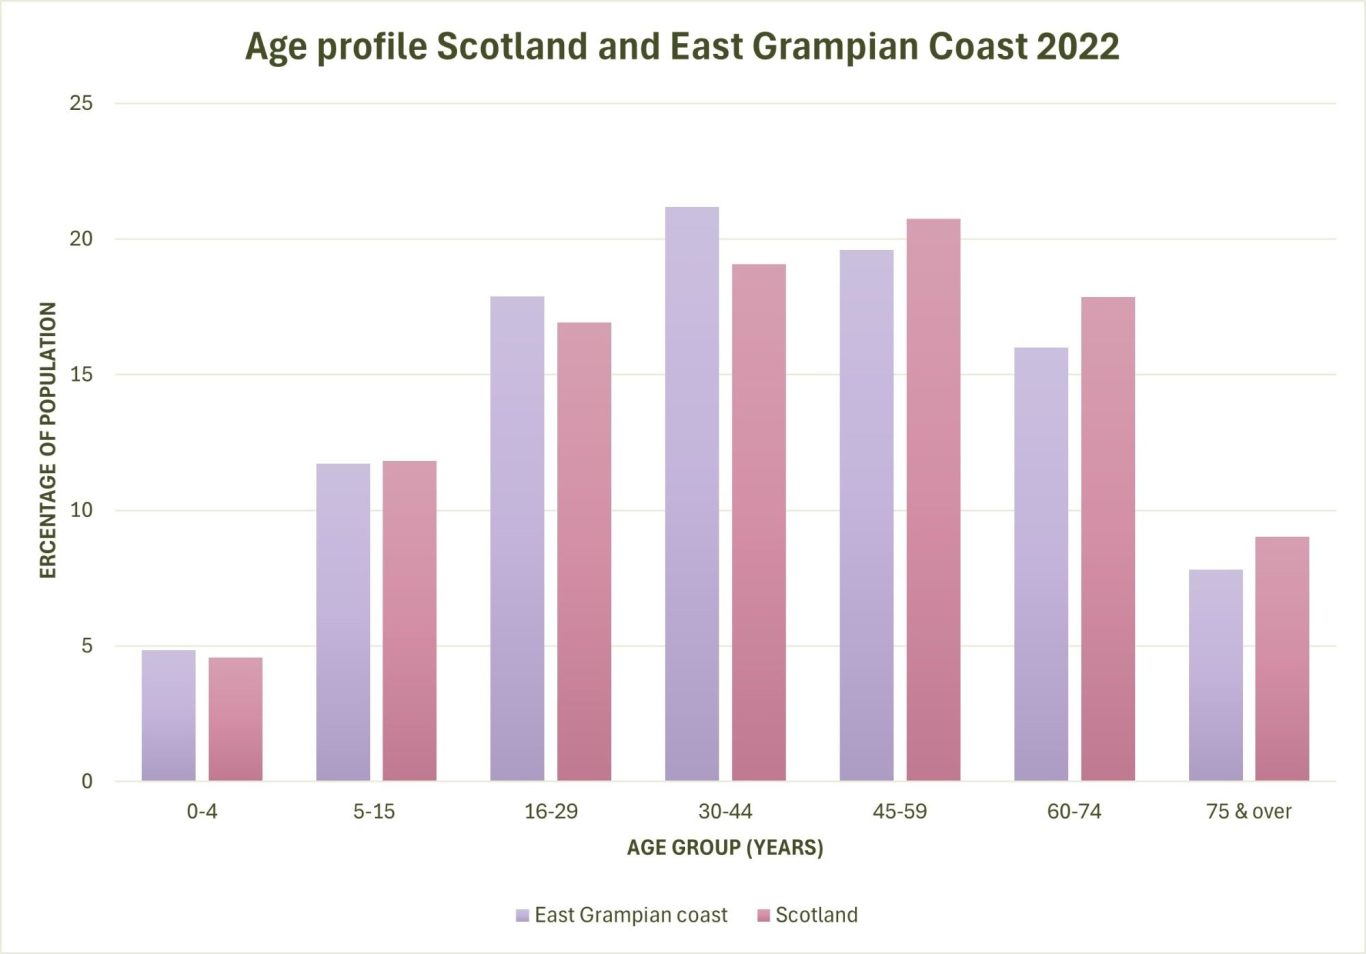
Figure 1: Age Profile of East Grampian Coast and Scotland (Census Data 2022)
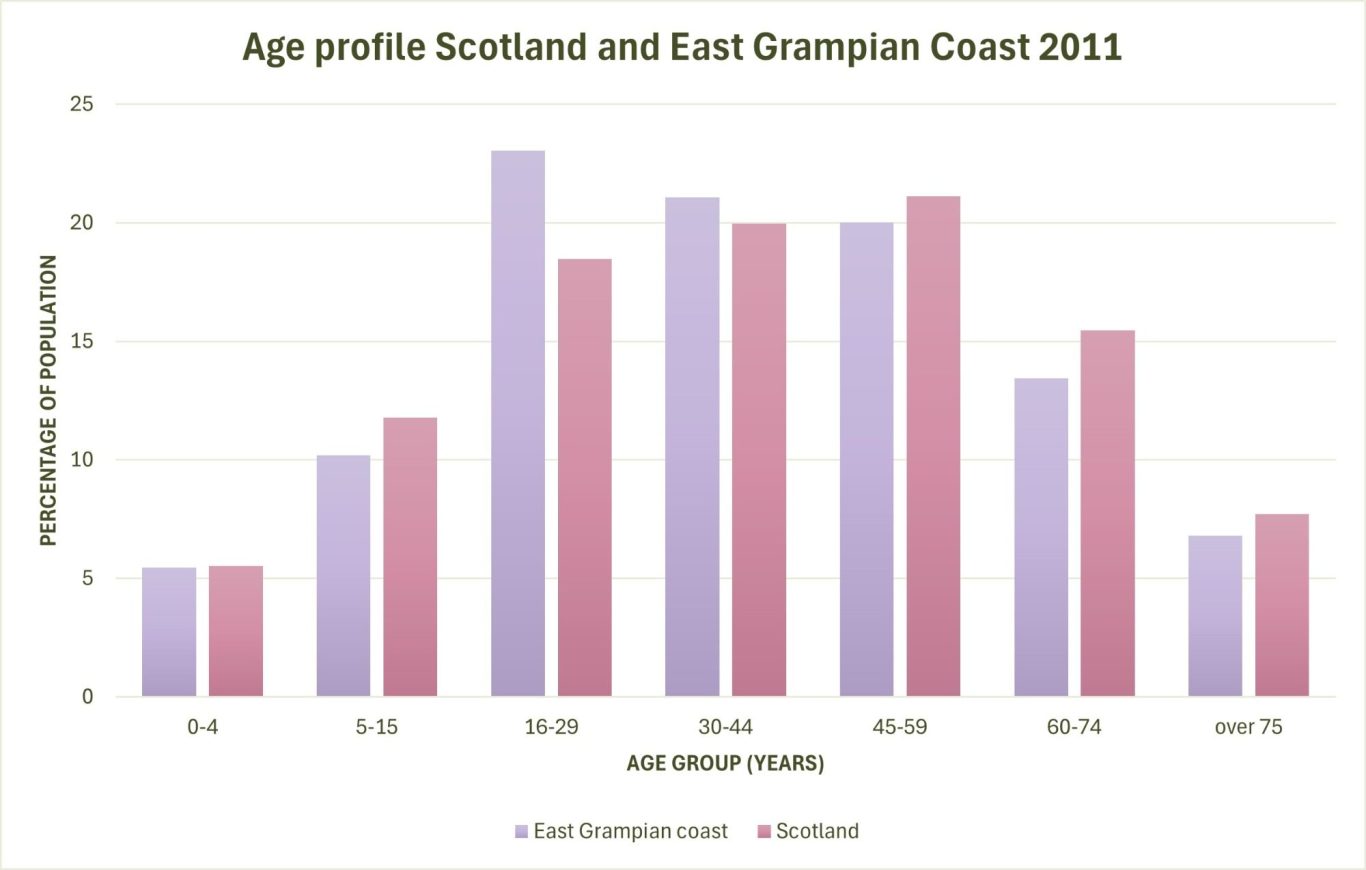
Figure 2: Age Profile of East Grampian Coast and Scotland (Census Data 2011)
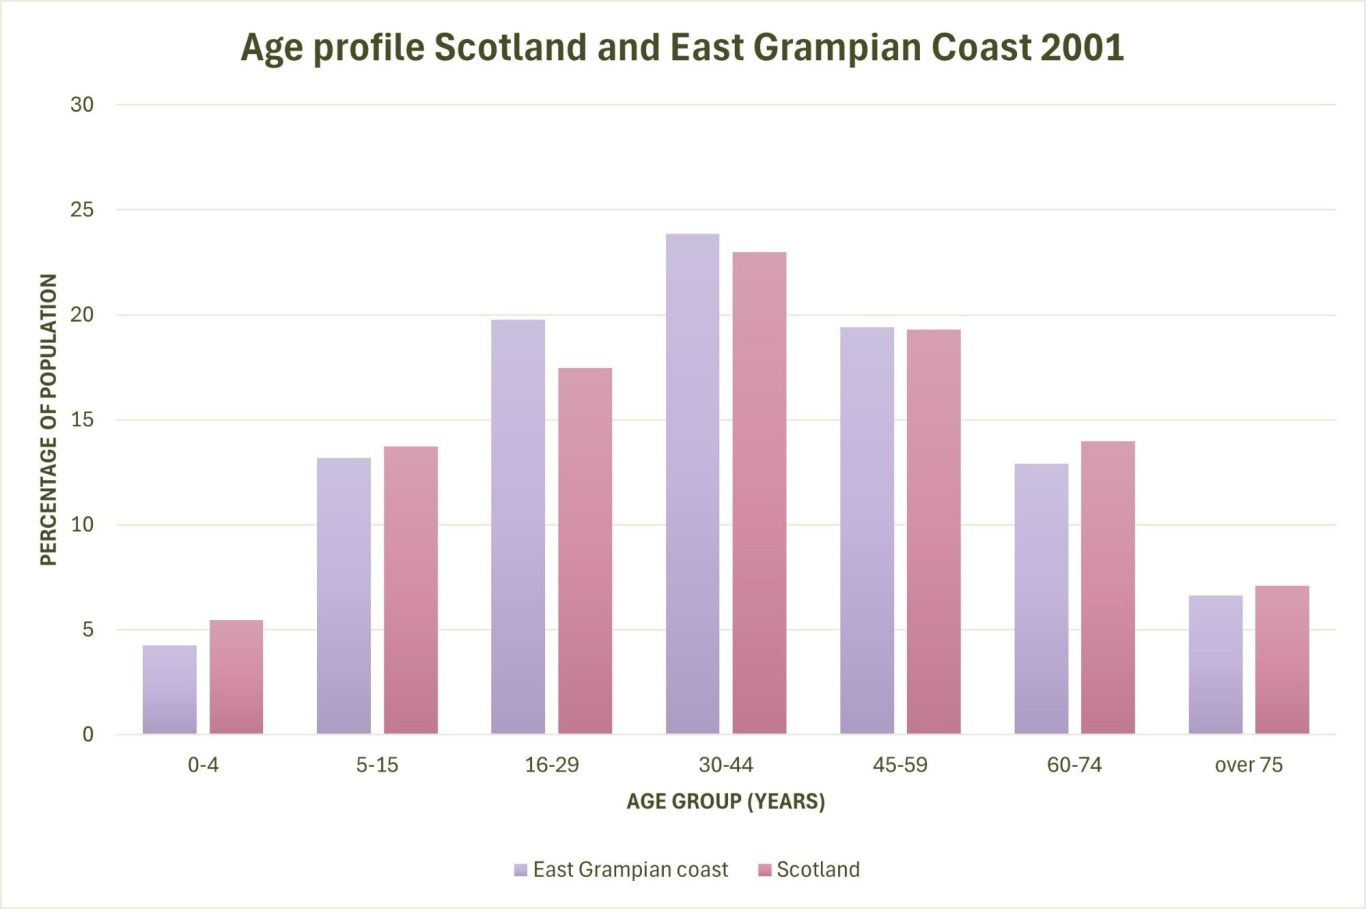
Figure 3: Age Profile of East Grampian Coast and Scotland (Census Data 2001)
The areas included in the East Grampian statistic can be seen following this link.
09/01/2025 by Ian Hay
13/03/2025 by Charlotte Tomlinson
Live - next update 18/03/2027
To report errors, highlight new data, or discuss alternative interpretations, please complete the form below and we will aim to respond to you within 28 days
Telephone: 07971149117
E-mail: ian.hay@stateofthecoast.scot

We need your consent to load the translations
We use a third-party service to translate the website content that may collect data about your activity. Please review the details in the privacy policy and accept the service to view the translations.