
Aberdeen City Air Quality
Key Findings
Scotland’s air quality is monitored by the Scottish Government (2021 a). Hourly measurements of air pollutants are recorded throughout the country and published online at: https://www.scottishairquality.scot/.
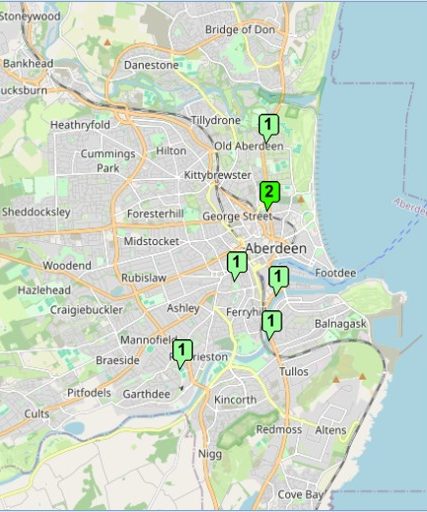
In Aberdeen, monitoring stations are located on King Street, Erroll Park, Market Street, Union Street, Wellington Road, and Anderson Drive (fig. 1). These sites measure readings of NO, NO2, PM10, PM2.5, and PM1.
Summary of Pollutant Types Measured in Aberdeen:
NO2: Nitrogen Dioxide
Vehicle engines produce the major method of NO2, but it can also be produced by other combustion reactions like tobacco smoking and gas burning stoves (Jarvis et al, 2010).
The health effects of inhaling unnatural volumes of NO2 are many and varied, including increased vulnerability to respiratory illnesses (Scottish Government, 2021 b), worsened effects of food allergies, and reduced fertility (Jarvis et al, 2010).
NO: Nitric Oxide
A precursor to Nitrogen Dioxide, NO alone does not damage human health. It is produced via the burning of fuel (combustion reactions), so is often found in high concentrations at roadsides. On entering the atmosphere, NO is quickly oxidised (combines with oxygen) to form NO2. (Scottish Government, 2021 b).
PM10, PM2.5, and PM1: Fine Particles
These tiny pieces of Particulate Matter are constructed of liquids, solids, and gases, all in a tiny microns-wide package (California Air Resource Board, n.d.). Their sizes vary by their name, PM10 being 10 microns in diameter for example. For context, human hair is 50-70 microns in diameter (EPA, 2024).
These particles can be produced by combustion reactions, often from car engines, or be blown from other sources like the atmosphere, deserts, soils and construction sites (Scottish Government, 2021 b).
Despite being so tiny, their inhalation can cause significant health effects. They can interfere with lung function, worsen asthma and respiratory illnesses, and even lead to hard attacks or death for those with existing health conditions (EPA, 2024). PM2.5 specifically is thought to be the worst form of air pollution for causing illness (California Air Resource Board, n.d.).
Air Pollution Thresholds:
The Scottish Government has determined maximum safe concentrations for these damaging air pollutants. Anything above these concentrations is considered a risk to human health. (Scottish Government, 2021 c)
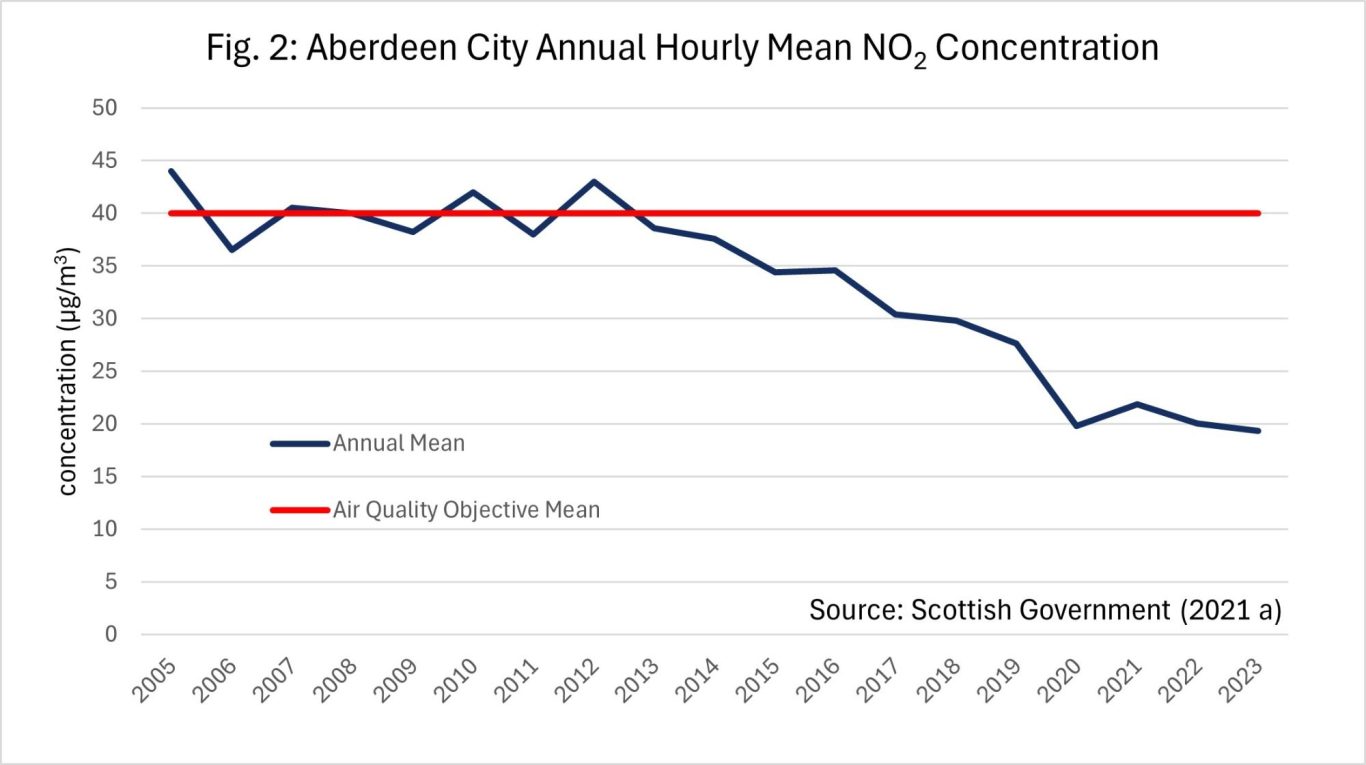
NO2: An average annual mean of 40 µg m-3, and hourly means should not exceed 200 µg m-3 more than 18 times per year.
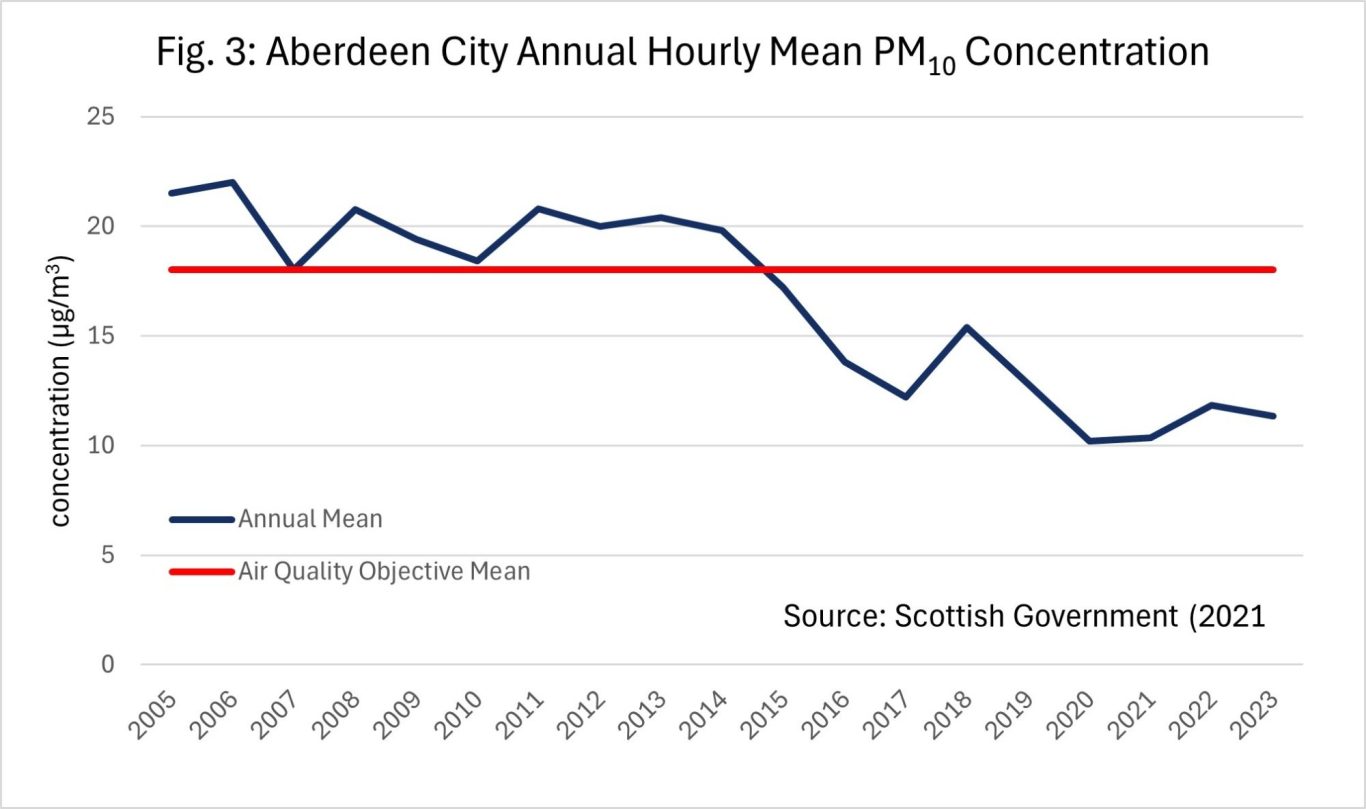
PM10: An average annual mean of 18 µg m-3, and the 24-hour mean should not exceed 50 µg m-3 more than 7 times per year
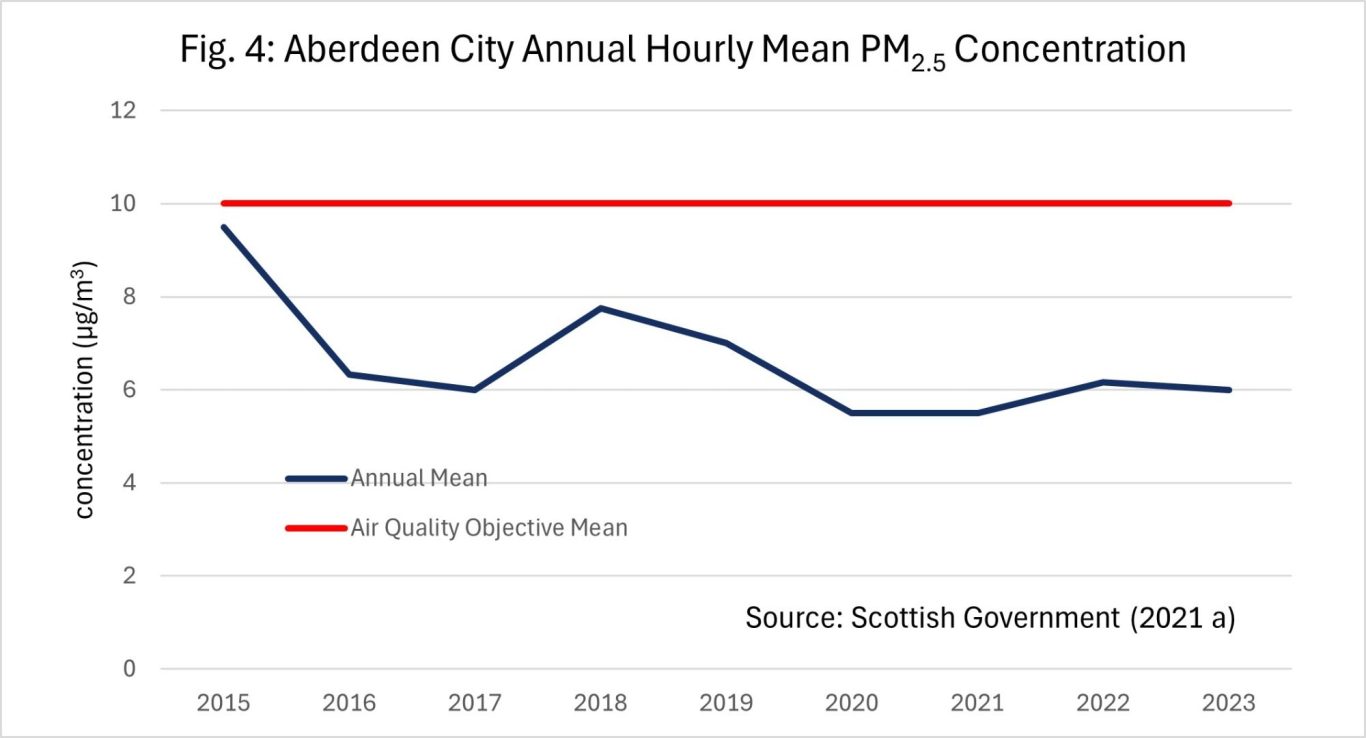
PM2.5: An average annual mean of 10 µg m-3.
Overall Aberdeen Air Quality:
The annual hourly mean NO2, PM10, and PM2.5 readings for the whole city were averaged to produce the graphs in figs. 2, 3 and 4. All data is from the Scottish Government (2021 a). On average, the air quality of Aberdeen city centre now falls within the recommended air quality threshold. For NO2 levels (fig. 2), from 2005-2012 the level fluctuated around the threshold of 40 µ m-3, then post-2012 the average concentration dropped nearly every year. By 2015 the PM10 concentration (fig. 3) had crossed the threshold, later fluctuating but continuing to drop overall. Data on PM2.5 concentrations (fig. 4) does not have as great a temporal span as the other pollutants; however, it has never been recorded above the 10 µg m-3 threshold.
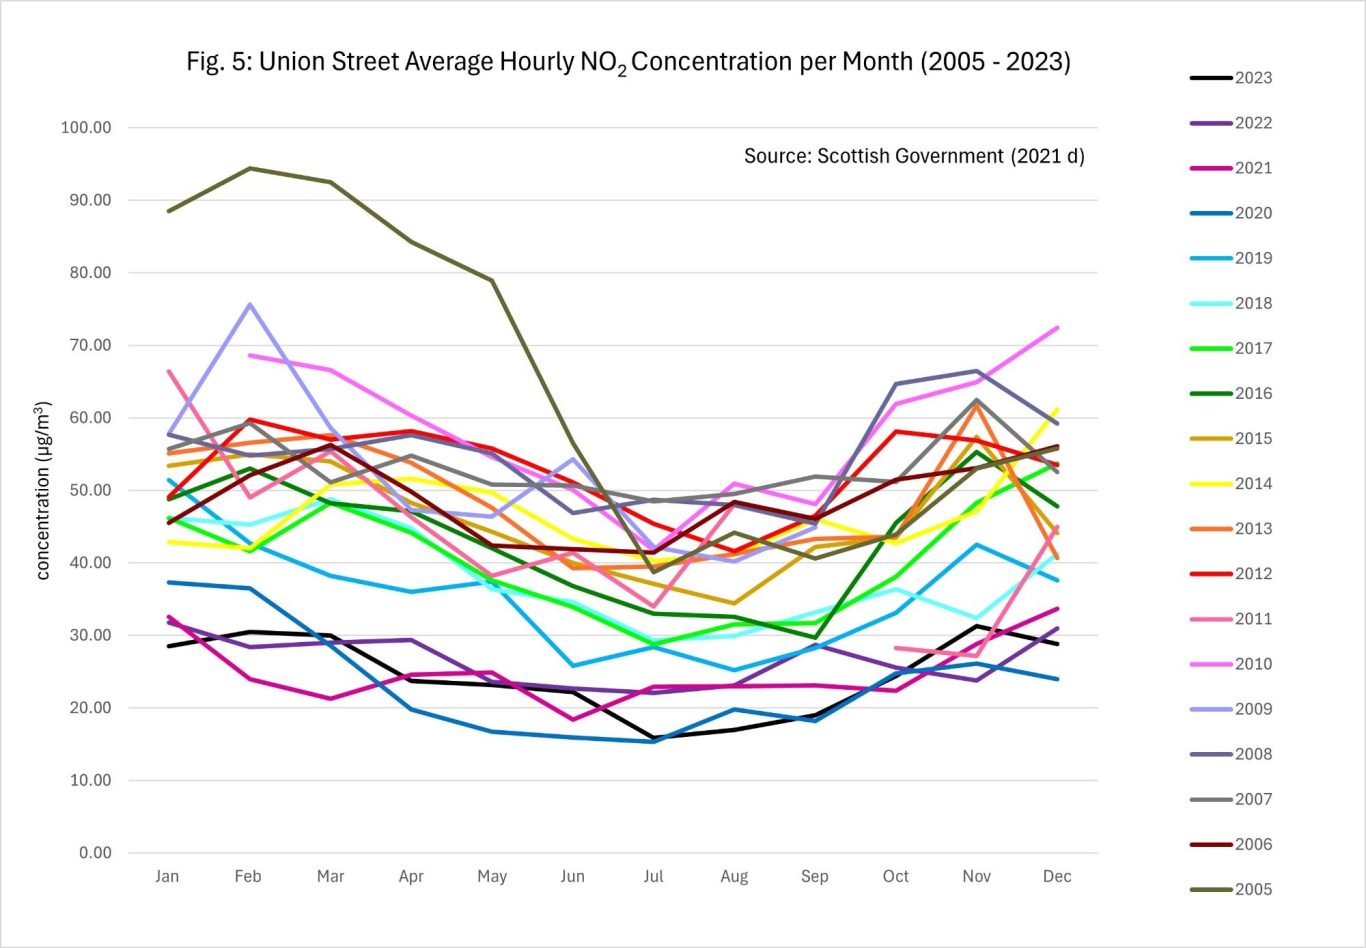
Additionally, an analysis of monthly NO2 data for Aberdeen Union Street over 18 years (fig. 5) reveals a seasonal trend to air quality. The values appear lowest during the summer months, perhaps when more people are walking rather than driving through the town. Pollutant concentrations peak in December – January, likely a combination of a busy shopping season, and higher car use. Another notable trend is the decline of NO2 concentrations from 2005 – 2023, reflecting the improvements to pollution concentrations shown in figs. 2, 3 and 4.
Notes
None
Linked Information Sheets
- Air quality overview Aberdeen
- Union Street Aberdeen
- Market Street Aberdeen
- Kings Street Aberdeen
- Anderson Drive Aberdeen
- Wellington Road Aberdeen
- Errol Place Aberdeen
- Cold Ironing
- Adoption of Low Emissions Zones
Key sources of Information
California Air Resource Board (n.d.) Inhalable Particulate Matter and Health
EPA (2024) Health and Environmental Effects of Particulate Matter (PM)
Jarvis et al (2010) Nitrogen dioxide, WHO Guidelines for Indoor Air Quality
Scottish Government (2021 a) Latest Air Quality Forecast
Scottish Government (2021 b) Pollutants overview
Scottish Government (2021 c) Standards
Scottish Government (2021 d) Site Data: Aberdeen Union Street Roadside
Reviewed on/by
Status
First Draft
To report errors, highlight new data, or discuss alternative interpretations, please complete the form below and we will aim to respond to you within 28 days
Contact us
Telephone: 07971149117
E-mail: ian.hay@stateofthecoast.scot

We need your consent to load the translations
We use a third-party service to translate the website content that may collect data about your activity. Please review the details in the privacy policy and accept the service to view the translations.