www.stateofthecoast.scot
Oceanic Warming
Key Findings
As the earth is warmed by increasing atmospheric greenhouse gases, the vast majority (91%) of this excess heat is taken up by the oceans (Lindsey & Dahlman, 2023). 2024 was a record year for Sea Surface Temperatures (SST)*, averaging ~21°C throughout January to April (BBC, 2024). While the tail end of the 2023 El Niño event did contribute to this extreme heat, the underlying trend of heating oceans is undeniably driven by increasing greenhouse gases. 71% of the world's coastlines warmed over the period of 1982–2010 , while global SSTs have consistently measured above the 1955-2006 average since 1994, as shown in Fig. 1 (Ruela et al 2020; Lindsey & Dahlman, 2023).
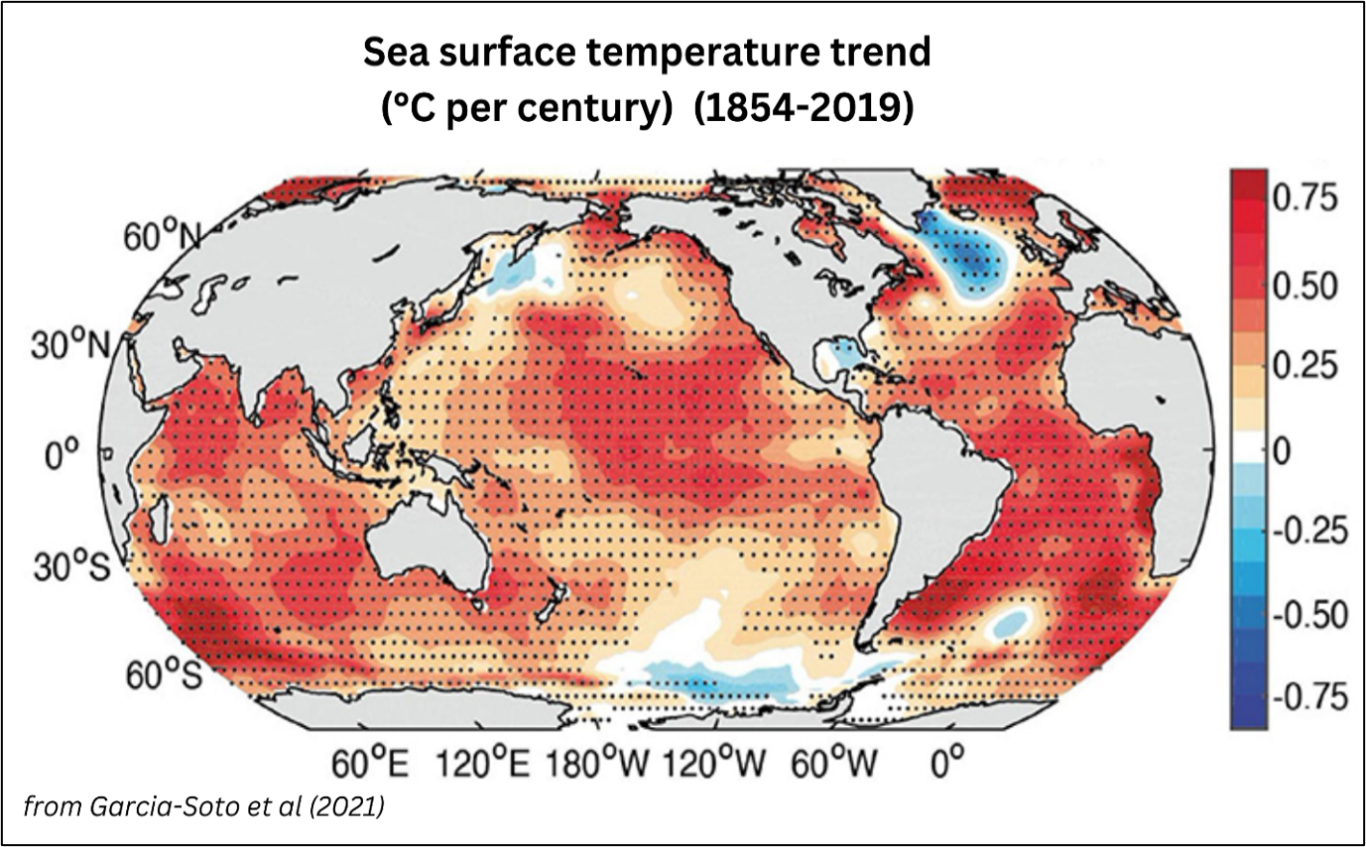
A few areas of the global ocean have not followed this warming trend, instead cooling at the surface as shown in Fig. 2. Notably, a large cooling area is found around the Northern Atlantic and the Labrador Sea, to the West of the UK (Garcia-Soto et al, 2021). With another area of cooling located around the West Antarctic, the melting of glacial ice is likely contributing to these cooling surface waters.
Of the warming oceans, the seas to the North of Europe (e.g. the Norwegian and Barnet seas) are projected to experience the most intense warming globally, as is demonstrated in fig. 3. Both moderate and extreme emissions scenarios display a cluster of warming around Northern Europe, potentially being felt as far west as the UK under the extreme scenario (Ruela et al, 2020).
*SST is a common metric for monitoring ocean temperatures, as the sea surface is the first layer of the ocean to reflect warming trends.
Scotland’s Temperatures:
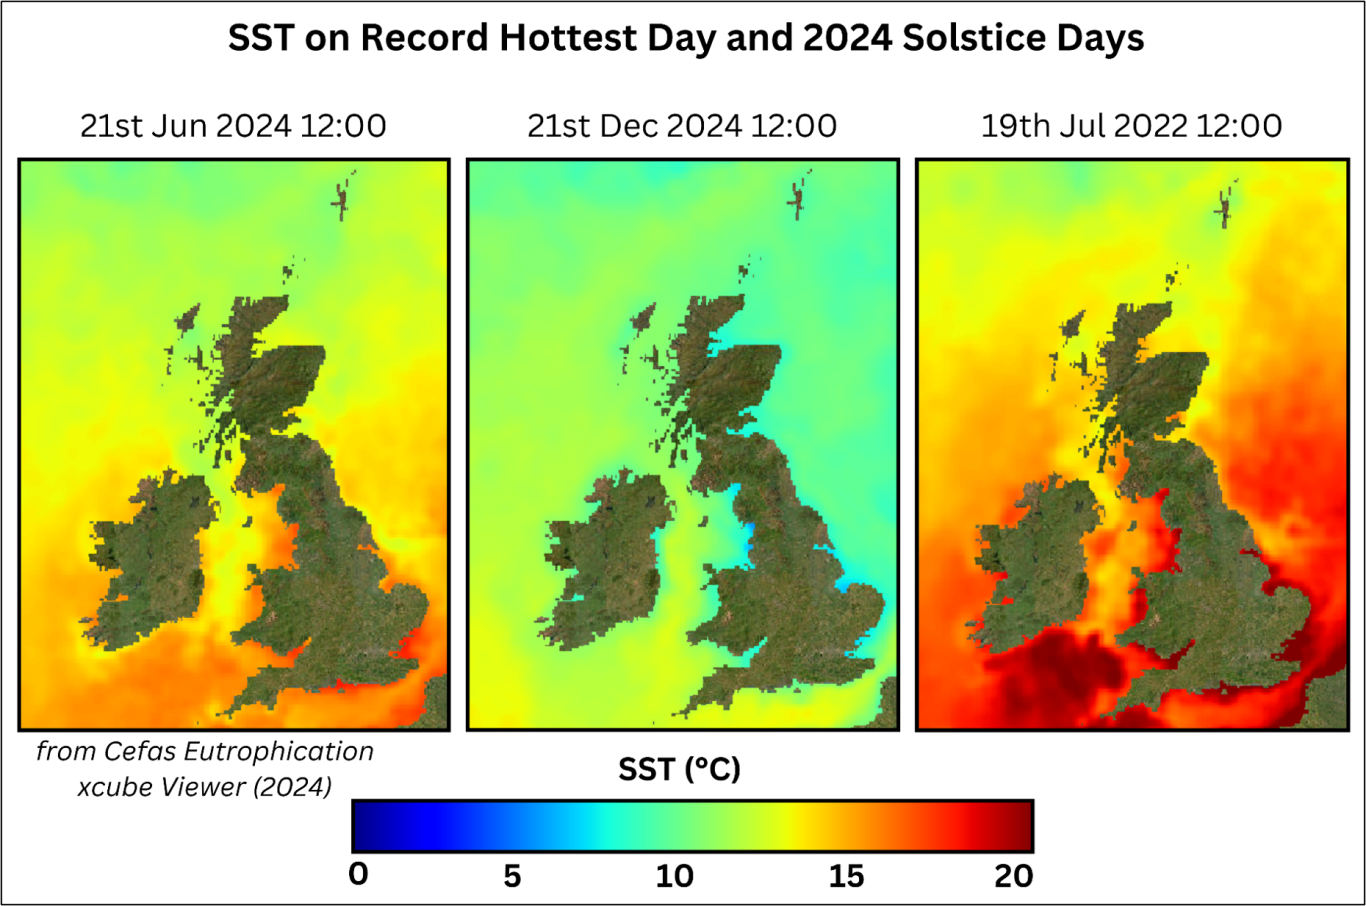
Fig. 4 demonstrates the current condition of Scotland’s waters, representing SST on the longest and shortest days of 2024, as well as on the hottest ever recorded day (Cefas Eutrophication xcube Viewer, 2024). The East Grampian coastline is revealed to be one of the country’s coldest coasts, along with the Highlands and Islands. Even on the extremely hot 19th Jul (Met Office, 2024), temperatures on the East Grampian coast sat at only ~12 -15°C.
As discussed, much variation exists in the waters connected to Scotland’s seas, cooling to the west and warming to the east. Despite this uncertainty, Hughes et al (2018) estimate that Scotland’s marine waters warmed by 0.05-0.07°C each decade between 1893 and 2016. Fig. 5 shows the distribution of this warming, taking place around the entire Scottish coastline.
Although the Northeast region is shown to be relatively cool in Fig. 4, Fig. 5 shows the Northeast coast to have experienced the highest rate of warming in the country over the 1988-2017 period, at between 0.2 - 0.24°C per decade (Tinker & Howes, 2020). Looking to the future, Tinker and Howes (2020) predict a continued warming trend for the North Sea of between 2.6 and 3°C for the period of 1960 – 2099.
Impacts:
Oceanic warming brings many negative impacts, both to biodiversity and to humanity. Rising ocean temperatures push native species out of their native range, while allowing invasive species adapted to warmer conditions to get a foothold, such as Pacific Oyster and Slipper Limpet. These invasive organisms compete with remaining native and economically important species, damaging the industries that depend on them.
In addition to gradual changes, worsening marine heatwave events bring short-lived, extreme heat that can wipe out marine life within their concentrated areas (Frölicher et al, 2018). Furthermore, oceanic warming is known to increase the risk of extreme weather events (Venegas et al, 2023) – patterns that have already been observed in Scotland. 2023 was found to be the wettest year on record in the country, despite also being the 13th sunniest, suggesting the multiple extreme storm events were responsible for the high volumes of rain (James Hutton Institute, 2023).

Figure 1: (Lindsey & Dahlman, 2023): 3-month Average Global SST Compared to the 1955-2006 SST Average.

Figure 2: (Garcia-Soto et al, 2021): Change in SST between 1854 and 2019. Black dots mark 90% significance or above.

Figure 3: (Ruela et al, 2020): Global Predicted Change in SST from 1975-2100, based on intermediate (a - RCP 4.5) or extreme (b - RCP 8.5) climate outcomes. Black points represent limited conficence in estimates.

Figure 4: Sea Surface Temperature (°C) on the Solstice Days of 2024, and Scotland's Hottest Day on record (19th July 2022). Data from Cefas Eutrophication xcube Viewer (2024), and hottest day identified from Met Office (2024).

Figure 5: (Tinker & Howes, 2020): 1988-2017 °C per decade trend across the Northeast Atlantic. Crosses mark estimated below 95% confidence level.
Notes
It should be noted - data readings are taken from one location in Aberdeen, either Dyce (Met Office) or Craibstone (NOAA)
Linked Information Sheets
Key sources of Information
Carrington (2024) ‘Astounding’ ocean temperatures in 2023 intensified extreme weather, data shows
CEFAS (2024) Eutrophication xcube Viewer
Frölicher, Fisher, & Gruber (2018) Marine heatwaves under global warming
Garcia-Soto et al (2021) An Overview of Ocean Climate Change Indicators
https://data.marine.gov.scot/sites/default/files//SMFS%200904.pdf
James Hutton Institute (2023) 2023: Our wettest year yet
Lindsey & Dahlman (2023) Climate Change: Ocean Heat Content
Ruela et al (2020) Global and regional evolution of sea surface temperature under climate change
Tinker & Howes (2020) The impacts of climate change on temperature (air and sea)
Venegas et al (2023) Three decades of ocean warming impacts on marine ecosystems
Reviewed on/by
29/08/2024 Cathryn Lovie, updated 06/01/2025
02/09/2024 Ian Hay
20/09/2024 Mariia Topol, updated 06/01/2025
06/03/2025 by Charlotte Tomlinson
Status
Live - Next review due 06/03/2026
To report errors, highlight new data, or discuss alternative interpretations, please complete the form below and we will aim to respond to you within 28 days
Contact us
Telephone: 07971149117
E-mail: ian.hay@stateofthecoast.scot
We need your consent to load the translations
We use a third-party service to translate the website content that may collect data about your activity. Please review the details in the privacy policy and accept the service to view the translations.

