Marine Economy Scotland by sector
Key Findings
- Scotland’s marine economy includes a wide range of sectors creating employment. They provide an important source of income and employment across Scotland.
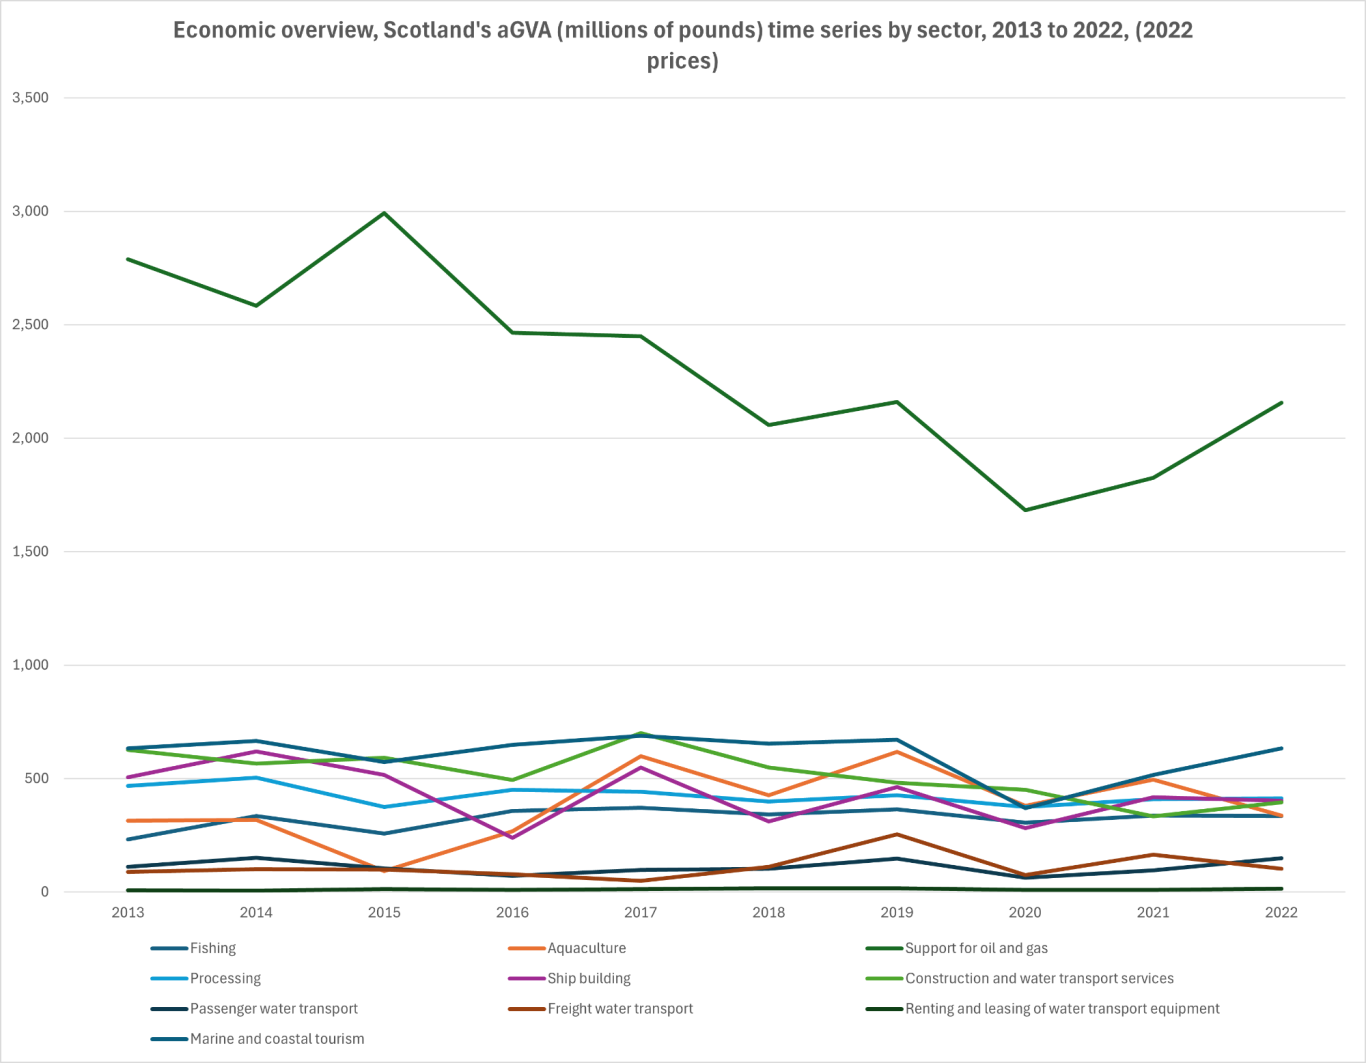
- These figures are measured by aGVA approximate Gross Value Added (aGVA), this is can be described as the amount a sector contributes to the economy minus the cost, it is approximately the same as profit. The servicing of the Oil and Gas Sector has seen a steady decline since 2013 but appears to be rebounding. The second largest sector, fishing has been steady out with 2020/21 when it was effected by COVID19, it is now recovering. (figure 1).
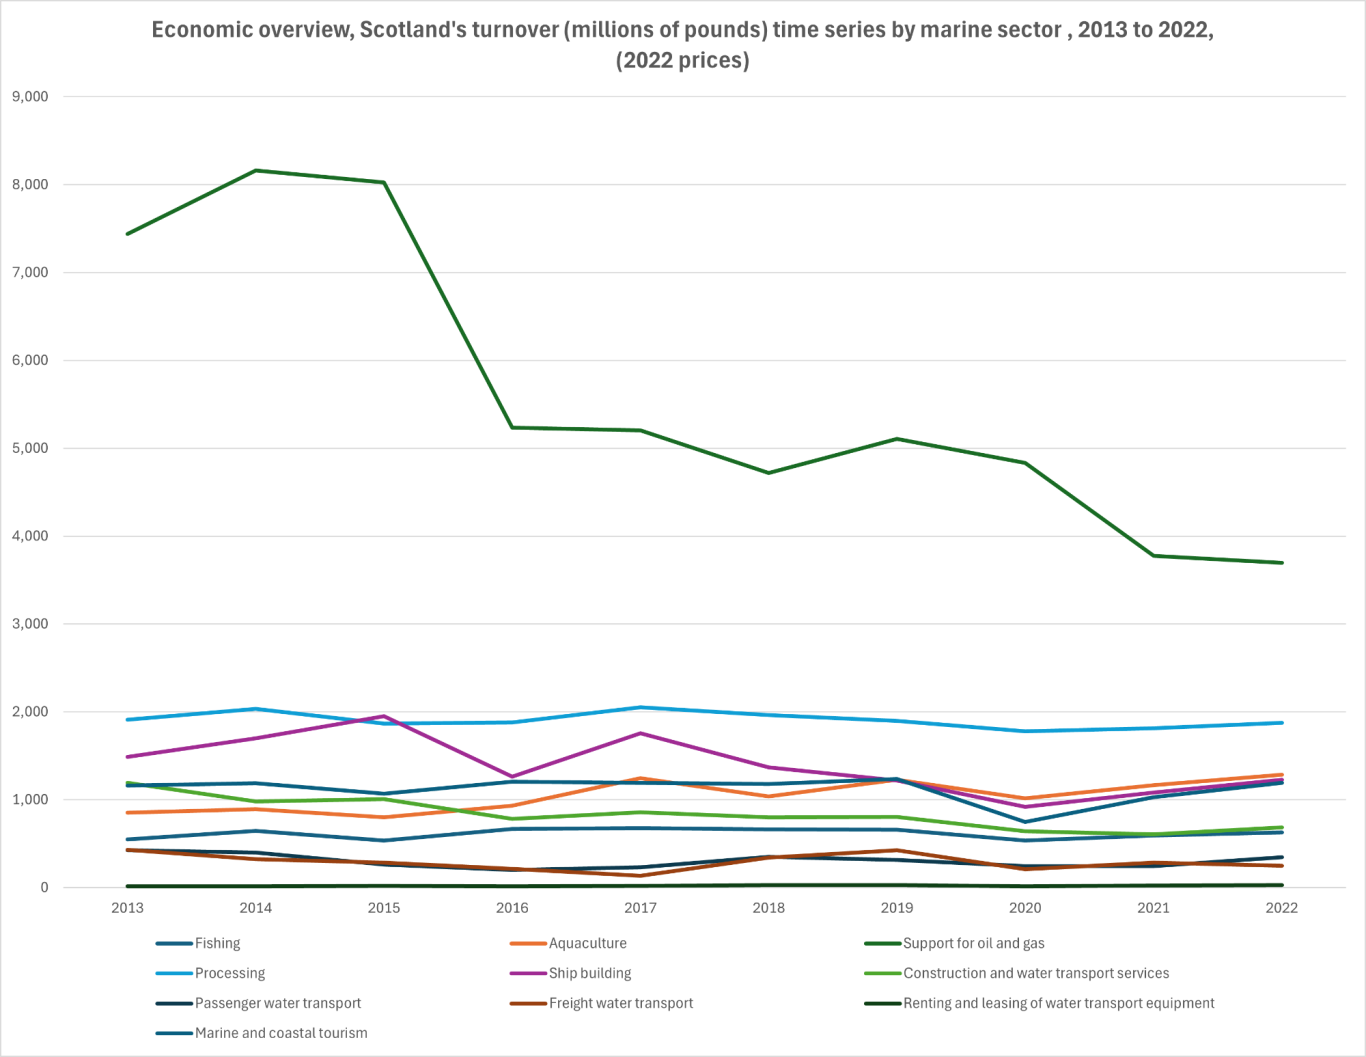
- Turnover is total amount spent in a sector, these figures have been more stable that aGVA with the exception of Oil and Gas that had an upswing around 2014 but is currently reducing. (figure 2).
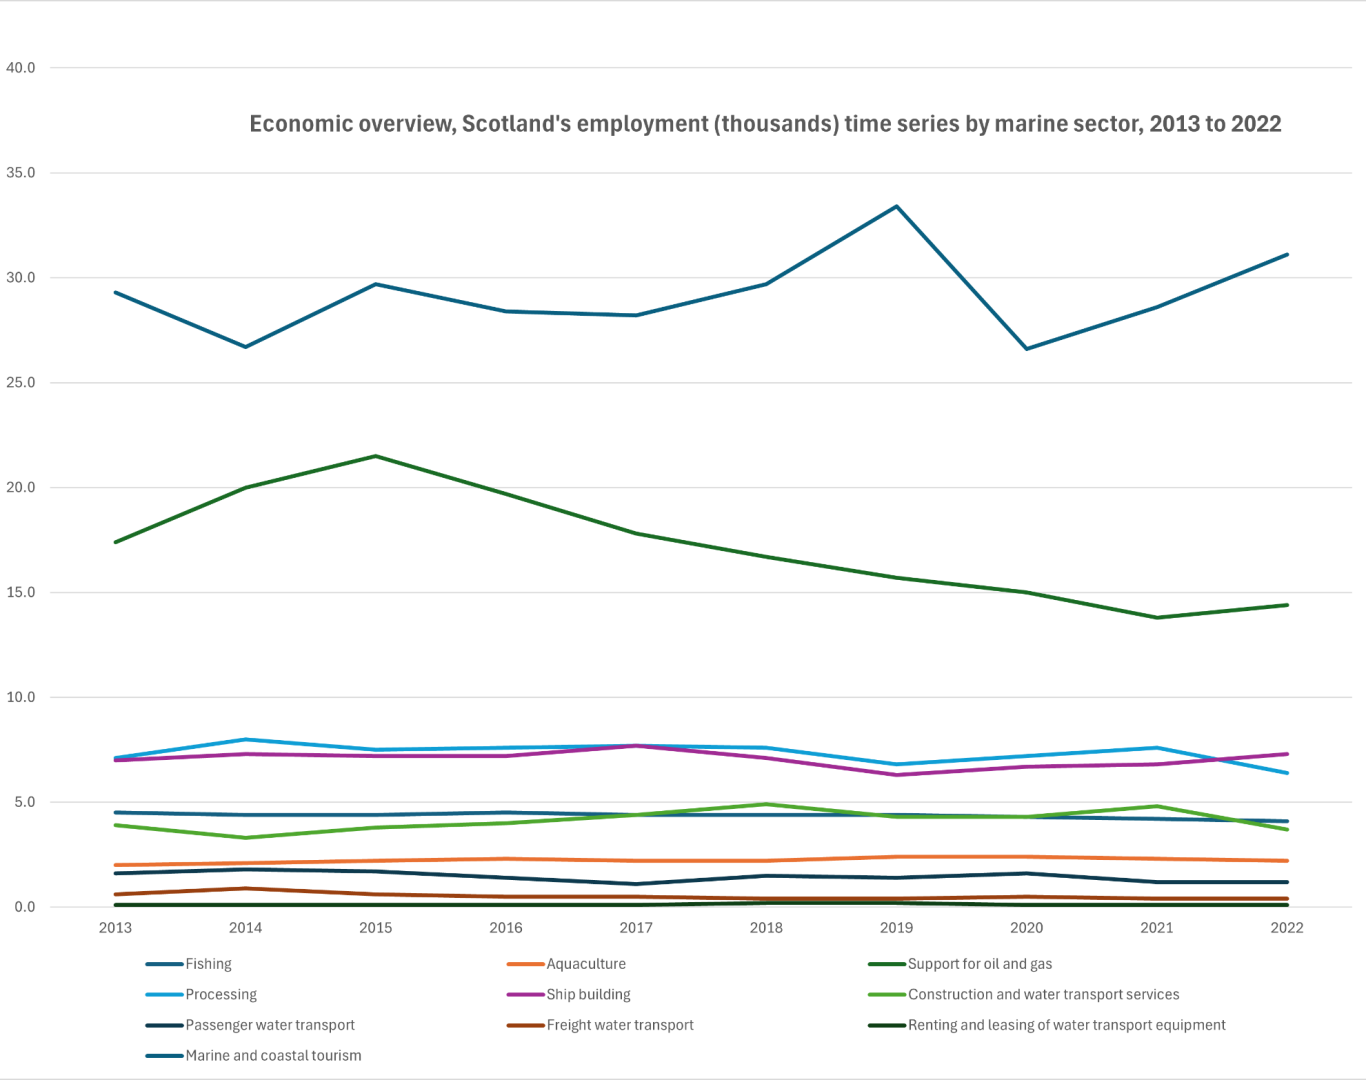
- Fishing continues to be the largest employer in the included marine sectors and has remained broadly stable through the period. (figure 3).

Figure 1

Figure 2

Figure 3
Notes
These figure do the Oil and Gas Service Sector but not Oil and Gas extraction.
To enable comparison of monetary values over time, all values are in 2022 prices. This involved applying HM Treasury deflation tables to previous years data. The sources and methods used in this report are set out in the Data and Methodology.
Linked Information Sheets
- Marine Tourism Businesses
- Visitor Numbers at Key Sites
- Cruise Tourism (Vessel Numbers)
- Cruise Tourism (Visitor Numbers)
- Contribution to Economy
- Employment
- Skills and Training
Key sources of Information
Supporting documents - Scotland's Marine Economic Statistics 2022 - gov.scot
Supporting documents - Scotland's Marine Economic Statistics 2021 - gov.scot
Supporting documents - Scotland's Marine Economic Statistics 2020 - gov.scot
Supporting documents - Scotland's Marine Economic Statistics 2019 - gov.scot
DCMS Economic Estimates 2019: Gross Value Added – Technical and quality assurance report - GOV.UK
Reviewed on/by
18/12/23 by Ian Hay
Status
First Draft (this is for demonstration only at this time and has not been reviewed)
To report errors, highlight new data, or discuss alternative interpretations, please complete the form below and we will aim to respond to you within 28 days
Contact us
Telephone: 07971149117
E-mail: ian.hay@stateofthecoast.scot
We need your consent to load the translations
We use a third-party service to translate the website content that may collect data about your activity. Please review the details in the privacy policy and accept the service to view the translations.

