Average Temperature (Summer)
Key Findings
Maximum Temperatures:
Scotland is not known for extreme heat, but that is not to say the sun never shines, especially in the summer. Between 1991-2020, Scotland’s average maximum summer temperature was 16.6°C, although this is 2.3oC lower than the UK wide average (Met Office, 2024). In some high-altitude highland regions, the maximum summer temperature rises to no more than 14°C (fig. 1). In comparison, the highest temperature on record in the country is 34.8°C, recorded in Charterhall in 2022 (Met Office, n.d. a).
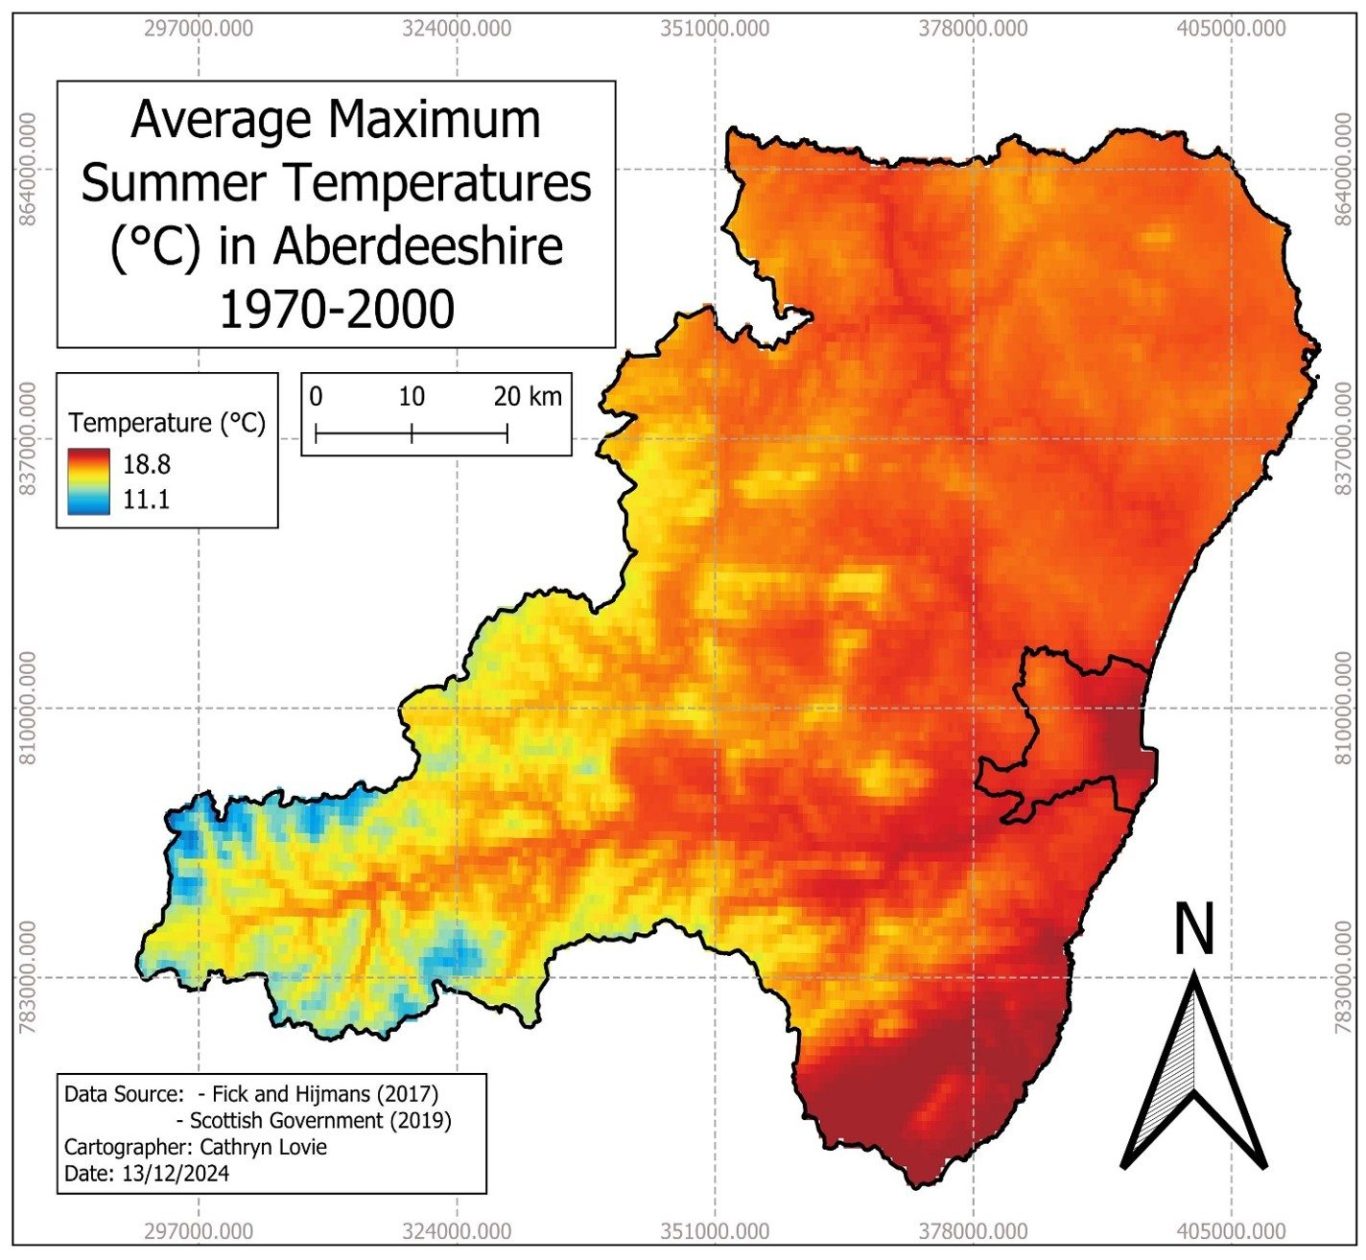
In the Aberdeen and Aberdeenshire area (fig. 2), the hottest temperatures are experienced in Aberdeen City and towards the South of the boundary around Laurencekirk, St Cyrus and Johnshaven. This warming to the south may be a product of the more southerly latitude and sheltered lowland topography, while the city centre hotspot is likely the result of the Urban Heat Island Effect. Commonly cities report higher temperatures than their adjacent landscapes, resulting from the effects of reduced natural spaces, high heat absorption by dark surfaces, heat production from houses and businesses, and many more factors, which artificially amplify the temperature (Debbage and Shepherd, 2015). In a Scotland wide context, the Northeast Region experiences a higher summer maximum (17.5°C) than the country’s average (16.6°C). Fig. 1 demonstrates this difference, showing the East Grampian area to be warmer in summer than the West Coast and highland regions, and slightly cooler than the lowlands to the south.
Averages Temperatures:
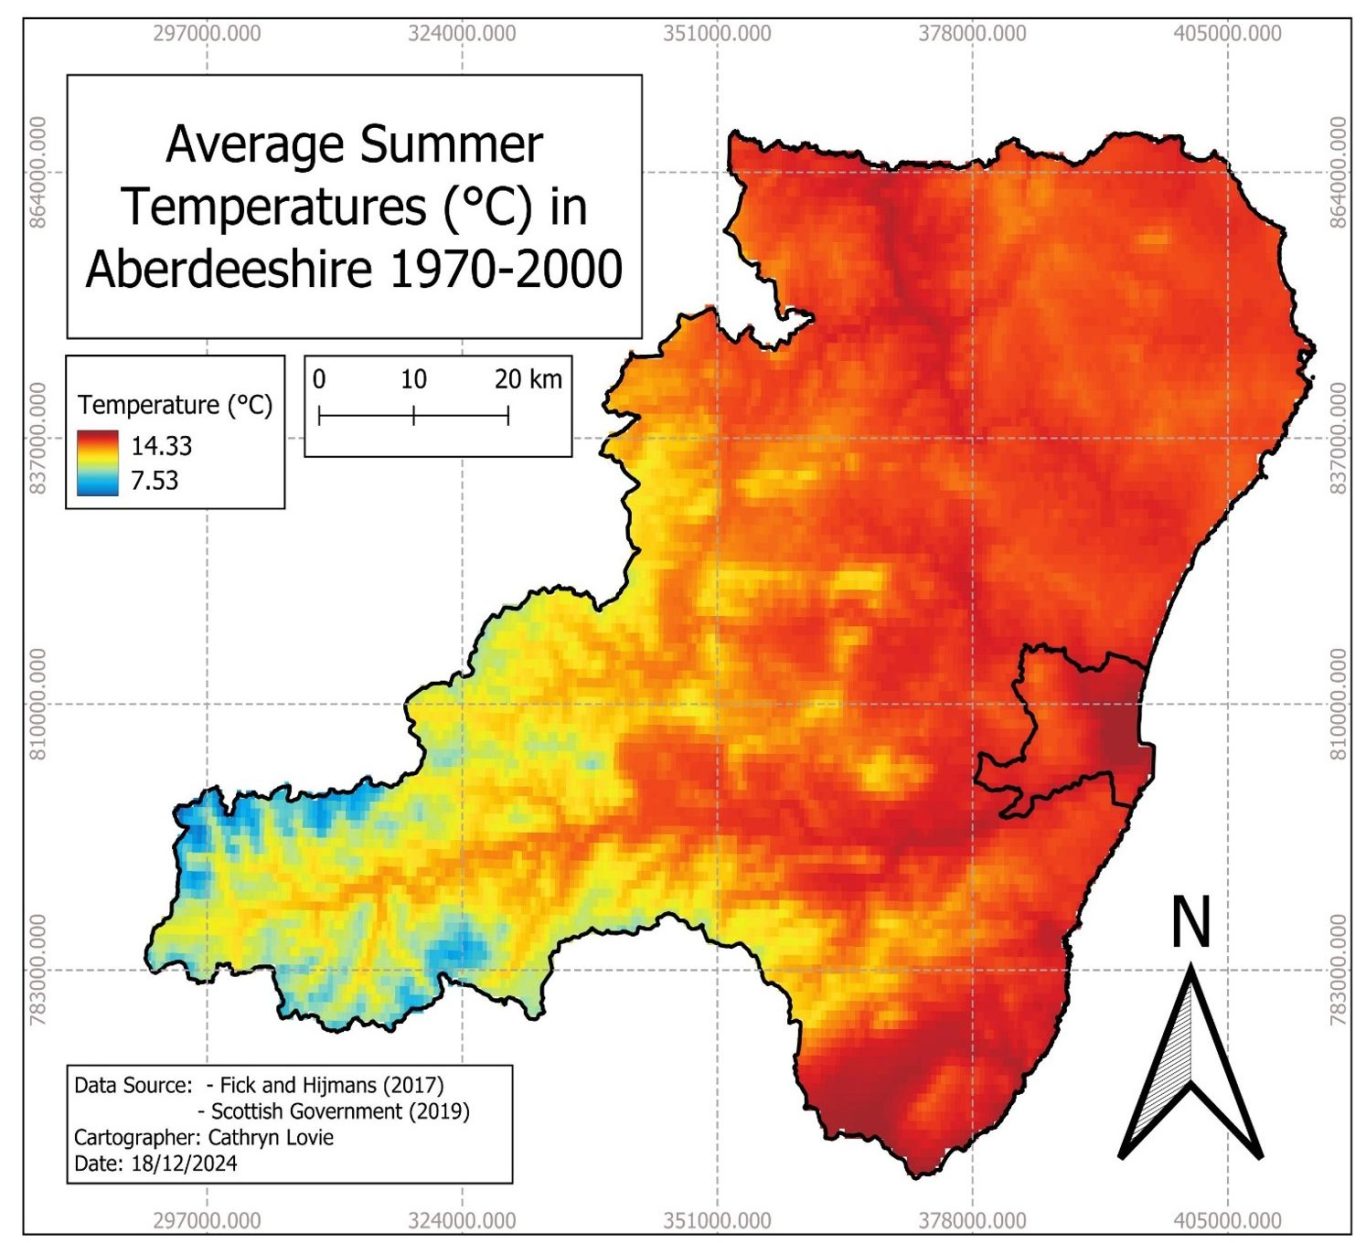
Average summer temperatures show a similar pattern to the summer maximums. Across Scotland, the Northeast is of middling temperatures, warmer than the highlands to the West, but cooler than the Southern lowlands (fig. 3). The Aberdeenshire region experiences summer average lows of 7.5°C in the more mountainous regions (fig. 4), but along the East Grampian coast the range is between 12-14°C (fig. 3). By this metric, the warmer Aberdeenshire regions are again observed to be inner city Aberdeen and southern Aberdeenshire.
Notably, in an international context, Scotland is much warmer than other countries of the same latitude, thanks to the North Atlantic Current bringing warmed waters north from the Mid-Atlantic (Scottish Government, 2011). For example, the average maximum summer temperature of Sitka, Alaska (at a similar 57° N to Aberdeen) is just 15.6°C (WorldClimate, 2024).
Controls on Scotland’s Temperature
Scotland’s temperature patterns are controlled by many interrelated factors, including latitude, topography, altitude, prevailing winds, and air masses. Across the ~200 km width of Scotland the climate is hugely varied, with the milder, wetter West, the drier and more varied East, and the cold, windy North (Scotland’s Environment, 2014).
Being surrounded by water, the seas play a key role in controlling Scotland’s climate. One major component is the already-mentioned influence of the North Atlantic Current, flowing north along the West Coast of Scotland. With heat from the current directed toward the country by South-westerly prevailing winds (Scottish Government, 2011), this regulates temperatures and brings rains to the West Coast (Met Office, n.d. b). The East coast is less affected by the North Atlantic Current, as it is protected by mountain ranges like the Grampian Mountains (Scotland’s Environment, 2014). This creates an effect known as a rain shadow, resulting in lower rainfall and more variable temperatures in the East. Additionally, the lower altitude of the East contributes to the region’s warmer summer temperatures than the North or the West (Scotland’s Environment, 2014).
It is also crucial to note that these temperature patterns are changing in response to anthropogenic climate change. Major warming has been recorded over Scotland in recent decades – to learn more please see the sheets ‘Aberdeen City Temperature Trends’ and ‘Scotland’s Projected Temperature’.

Fig. 1: Mean Maximum Summer Temperatures Across the UK (1991-2020) (Met Office, 2024)

Fig. 2: Average Maximum Summer Temperatures Across Aberdeeshire (1970-2000). Data Sources: Fick and Hijmans (2017), Scottish Government (2019)

Fig. 3: Mean Summer Temperatures Across the UK (1991-2020) (Met Office, 2024)

Fig. 4: Average Summer Temperatures Across Aberdeeshire (1970-2000). Data Sources: Fick and Hijmans (2017), Scottish Government (2019)
Notes
None
Linked Information Sheets
Key sources of Information
Deggage and Shepherd (2015) The urban heat island effect and city contiguity
Fick and Hijmans (2017) Global climate and weather data
Met Office (2024) Location-specific long-term averages
Met Office (n.d. a) UK climate extremes.
Met Office (n.d. b) Western Scotland: climate
Scotland’s Environment (2014) Climate
Scottish Government (2011) Scotland’s Marine Atlas
Reviewed on/by
16/12/2024 Cathryn Lovie
20/12/2024 Mariia Topol
Status
First Draft
To report errors, highlight new data, or discuss alternative interpretations, please complete the form below and we will aim to respond to you within 28 days
Contact us
Telephone: 07971149117
E-mail: ian.hay@stateofthecoast.scot
We need your consent to load the translations
We use a third-party service to translate the website content that may collect data about your activity. Please review the details in the privacy policy and accept the service to view the translations.

